
DOE Joint Genome Institute staff walk past murals on the third floor of the Integrative Genomics Building. located at Lawrence Berkeley National Laboratory in Berkeley, California.
Vision
Lead genomic innovation for a sustainable bioeconomy.
Mission
As a U.S. Department of Energy Office of Science user facility, we provide advanced genomic capabilities, large-scale data, and professional expertise to support the global research community in studies of complex biological and environmental systems. We optimize our service to the community through responsibly managing our people and resources.
Director’s Perspective
Nigel Mouncey, Director, DOE Joint Genome Institute
Honors & Awards
In 2023, several researchers were recognized by multiple organizations.


Accomplishments at a Glance
Below are briefs on some of the scientific collaborations that came out of the JGI in 2023, as well as highlights around our outreach efforts.
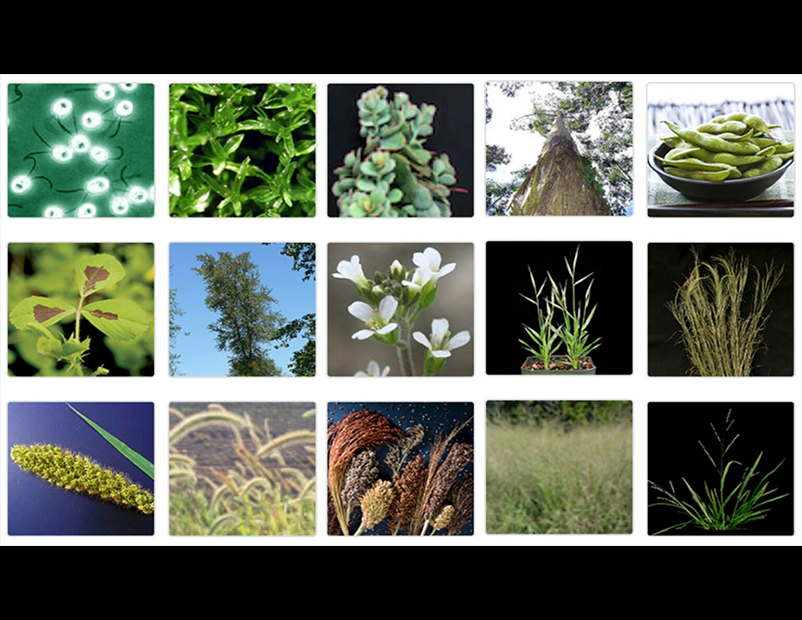 |
A Collaboration to Improve Plant Genome Annotations Across Species: Researchers have developed an atlas that maps gene expression patterns in the Arabidopsis root from single root cell profiles. |  |
Sequencing Sphagnum Leads to Discovery of Sex Chromosomes: Research illuminates the significant role sex plays in how this moss — which constitutes most peatlands — grows, stores carbon and responds to stress. |
 |
Eelgrass Proves to be Much Younger than We Thought: Investigating the evolutionary history of eelgrass shows it colonized the Arctic ocean as recently as 25,000 years ago. | 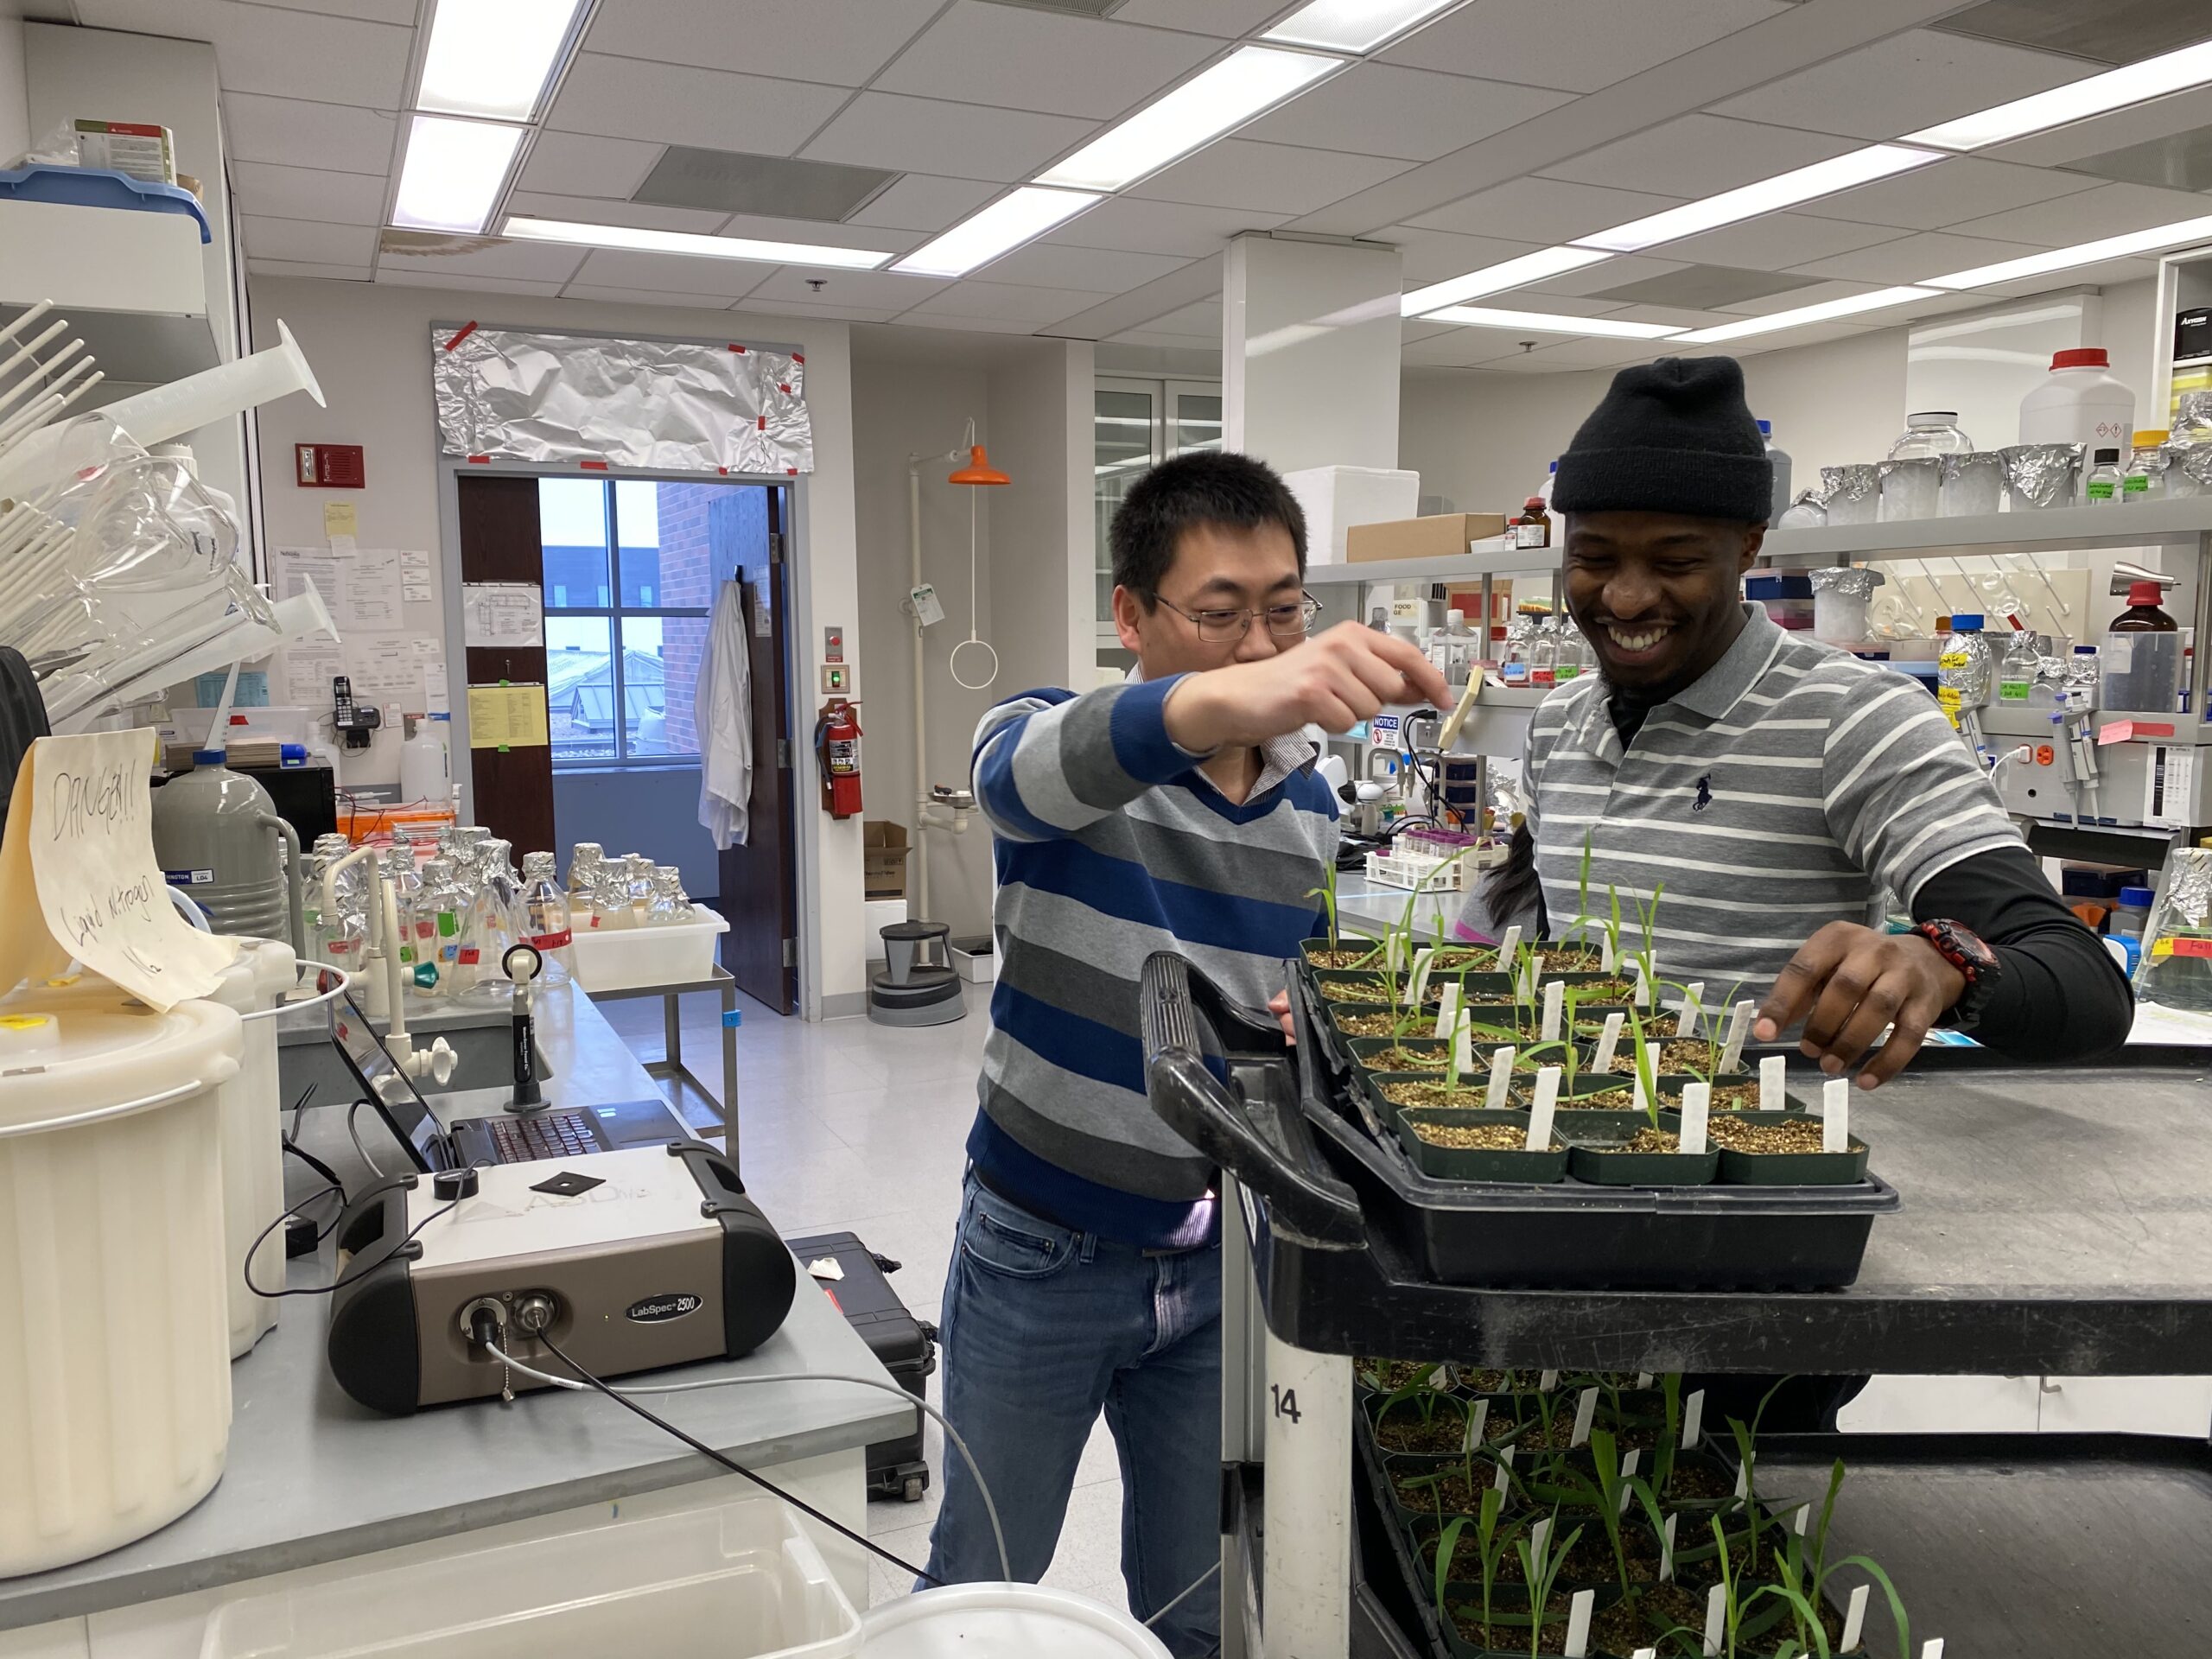 |
Crops as Tough as World Cup Turf: Grasses do better in our warming world than crops like corn and sorghum, so researchers looked into traits that could transfer from one to the other. |
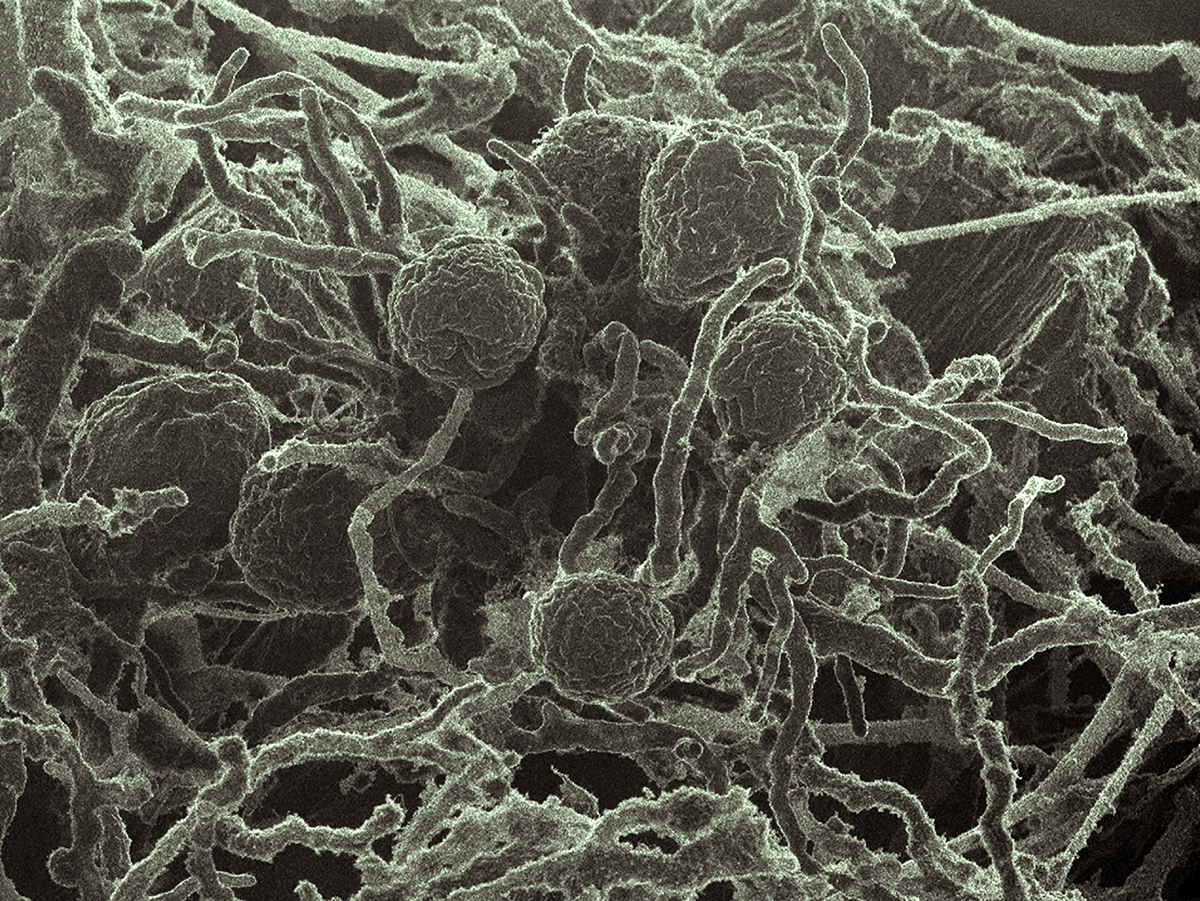 |
Busting the Unbreakable Lignin: This ground-breaking discovery demonstrated anaerobic fungi’s ability to break down lignin — the hardiest of plant materials. |  |
Tracing the Evolution of Shiitake Mushrooms: A fresh analysis of global Lentinula samples saw 24 new mushroom genomes sequenced and genomes assembled from 60 existing sequences. |
 |
Supercharging SIP in the Fungal Hyphosphere: Successful automation of aspects of stable isotope probing, used to study microbial communities, proved to vastly reduce labor and improve results. |  |
New Research Sheds Light on Diversity in the Deep Sea: Charting variability in microbial communities around hydrothermal vents and underwater volcanoes across five oceanic regions. |
 |
You Can Move, But You Can’t Hide: The geNomad software tool quickly identifies and classifies mobile genetic elements based upon their gene content and their genetic sequences. | 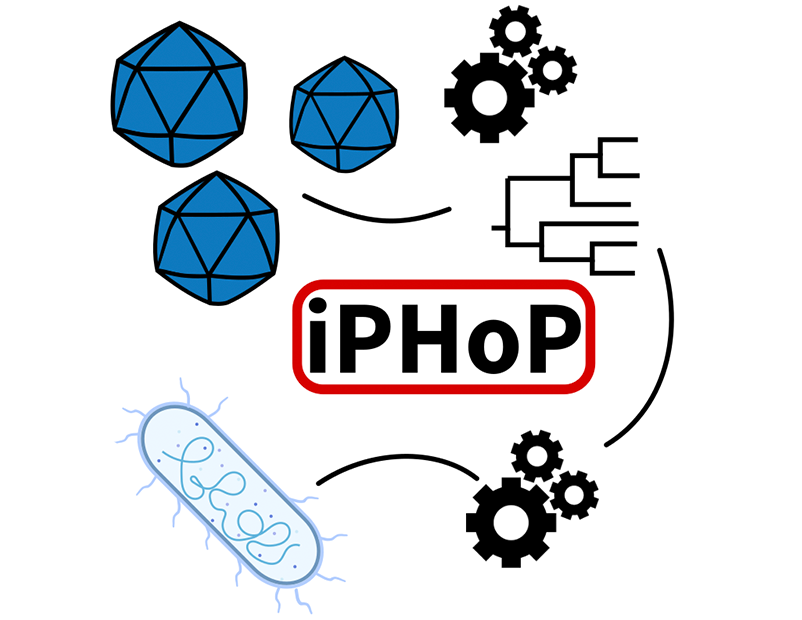 |
iPHoP: A Matchmaker for Phages and their Hosts: Building on existing virus-host prediction approaches, iPHoP reliably matches viruses with their archaea and bacteria hosts. |
 |
For the Tiniest Archaea, A Genomic Switch of Friend or Foe: Meta-omics datasets show that CRISPR-Cas systems determine mutualism or parasitism between some archaeal hosts and their hitchhikers. |  |
New Research Finds Flagella in the Terrestrial Roots of Marine Bacteria: A deeper understanding of how these bacteria evolved could help inform engineering microorganisms for biofuel production and other sustainable applications. |
 |
Methane Makers in Yosemite’s Lakes: The microbial communities in isolated, mountaintop lakes of the Sierra Nevada have a methane paradox, and show how climate change affects freshwater ecosystems. |
|
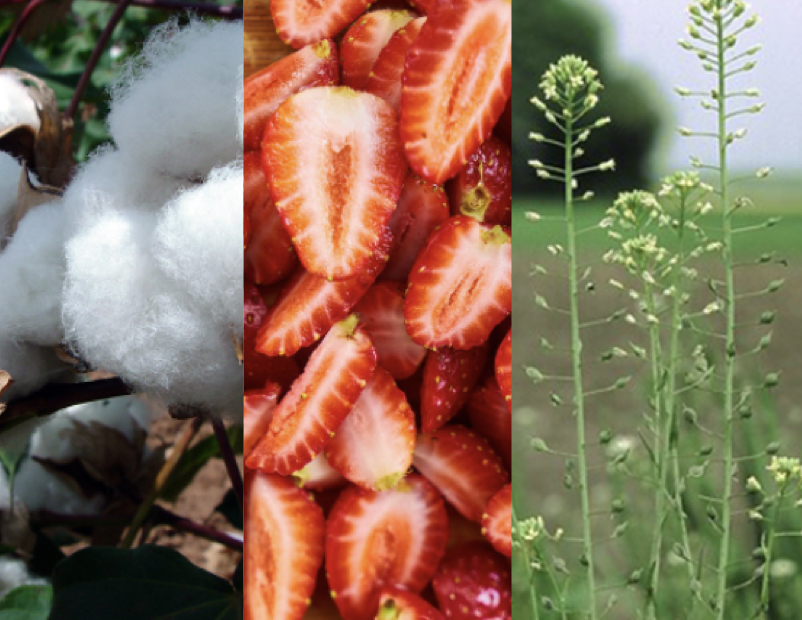
From Berkeley to Binghamton: Tracking Strawberry Evolution: A method for correctly identifying polyploid subgenomes without knowing their ancestral genomes was applied to plants including cotton and strawberry. |
 |
JGI-UC Merced Genomics Internship Program at 10: From two interns to 75 alumni in the decade since the inception of the JGI’s flagship internship program with UC Merced. |  |
Experimenting with EcoFABs for Student Labs: Encouraging STEM careers with small plastic growth chambers that enable researchers to compare their work consistently. |
Impact: By the Numbers
Spending Profile

Users on the Global Map

| North America | 1,694 | Asia | 82 | Europe | 479 | ||
| United States | 1,592 | China | 24 | Austria | 13 | Norway | 18 |
| Canada | 95 | India | 10 | Belgium | 17 | Poland | 2 |
| Mexico | 7 | Israel | 9 | Croatia | 1 | Portugal | 7 |
| Japan | 29 | Czech Republic | 13 | Russia | 5 | ||
| South America | 34 | Malaysia | 1 | Denmark | 17 | Serbia | 2 |
| Argentina | 1 | Singapore | 3 | Estonia | 2 | Slovenia | 2 |
| Brazil | 23 | South Korea | 6 | Finland | 13 | Spain | 43 |
| Chile | 2 | France | 62 | Sweden | 28 | ||
| Colombia | 1 | Africa | 14 | Germany | 86 | Switzerland | 12 |
| Ecuador | 1 | Morocco | 1 | Greece | 10 | Turkey | 1 |
| Peru | 1 | South Africa | 12 | Hungary | 10 | United Kingdom | 60 |
| Uruguay | 5 | Tunisia | 1 | Iceland | 1 | ||
| Ireland | 3 | Australia + New Zealand | 70 | ||||
| Italy | 22 | Australia | 53 | ||||
| Netherlands | 29 | New Zealand | 17 |
Users on the U.S. Map
Cumulative Number of Projects Completed |
Cumulative Number of Scientific Publications |
 |
|
Sequencing Output
(in billions of bases or GB)
The JGI supports short- and long-read sequencers, where a read refers to a sequence of DNA bases. Short-read sequencers produce billions of paired-end 150 basepair reads used for quantification, such as in gene expression analysis. Long-read sequencers currently average 60,000–70,000 bp reads and are used for de novo genome assembly. Combined short-read and long-read totals per year give JGI’s annual sequence output. The total sequence output in 2023 was 716,929 GB.
Sequencing Productivity
Billions of Base Pairs
Users Letters of Intent/Proposals Submitted & Approved
Computational Infrastructure

Daniela Cassol (right) and Mario Melara (left), two members of the JGI’s advanced analysis group, work behind the scenes on the bioinformatics tools that users have access to via the JGI Analysis Workflow Service (JAWS). These tools make it easier to run bioinformatics workflows across multiple resources, in order to foster scalable projects and collaboration.
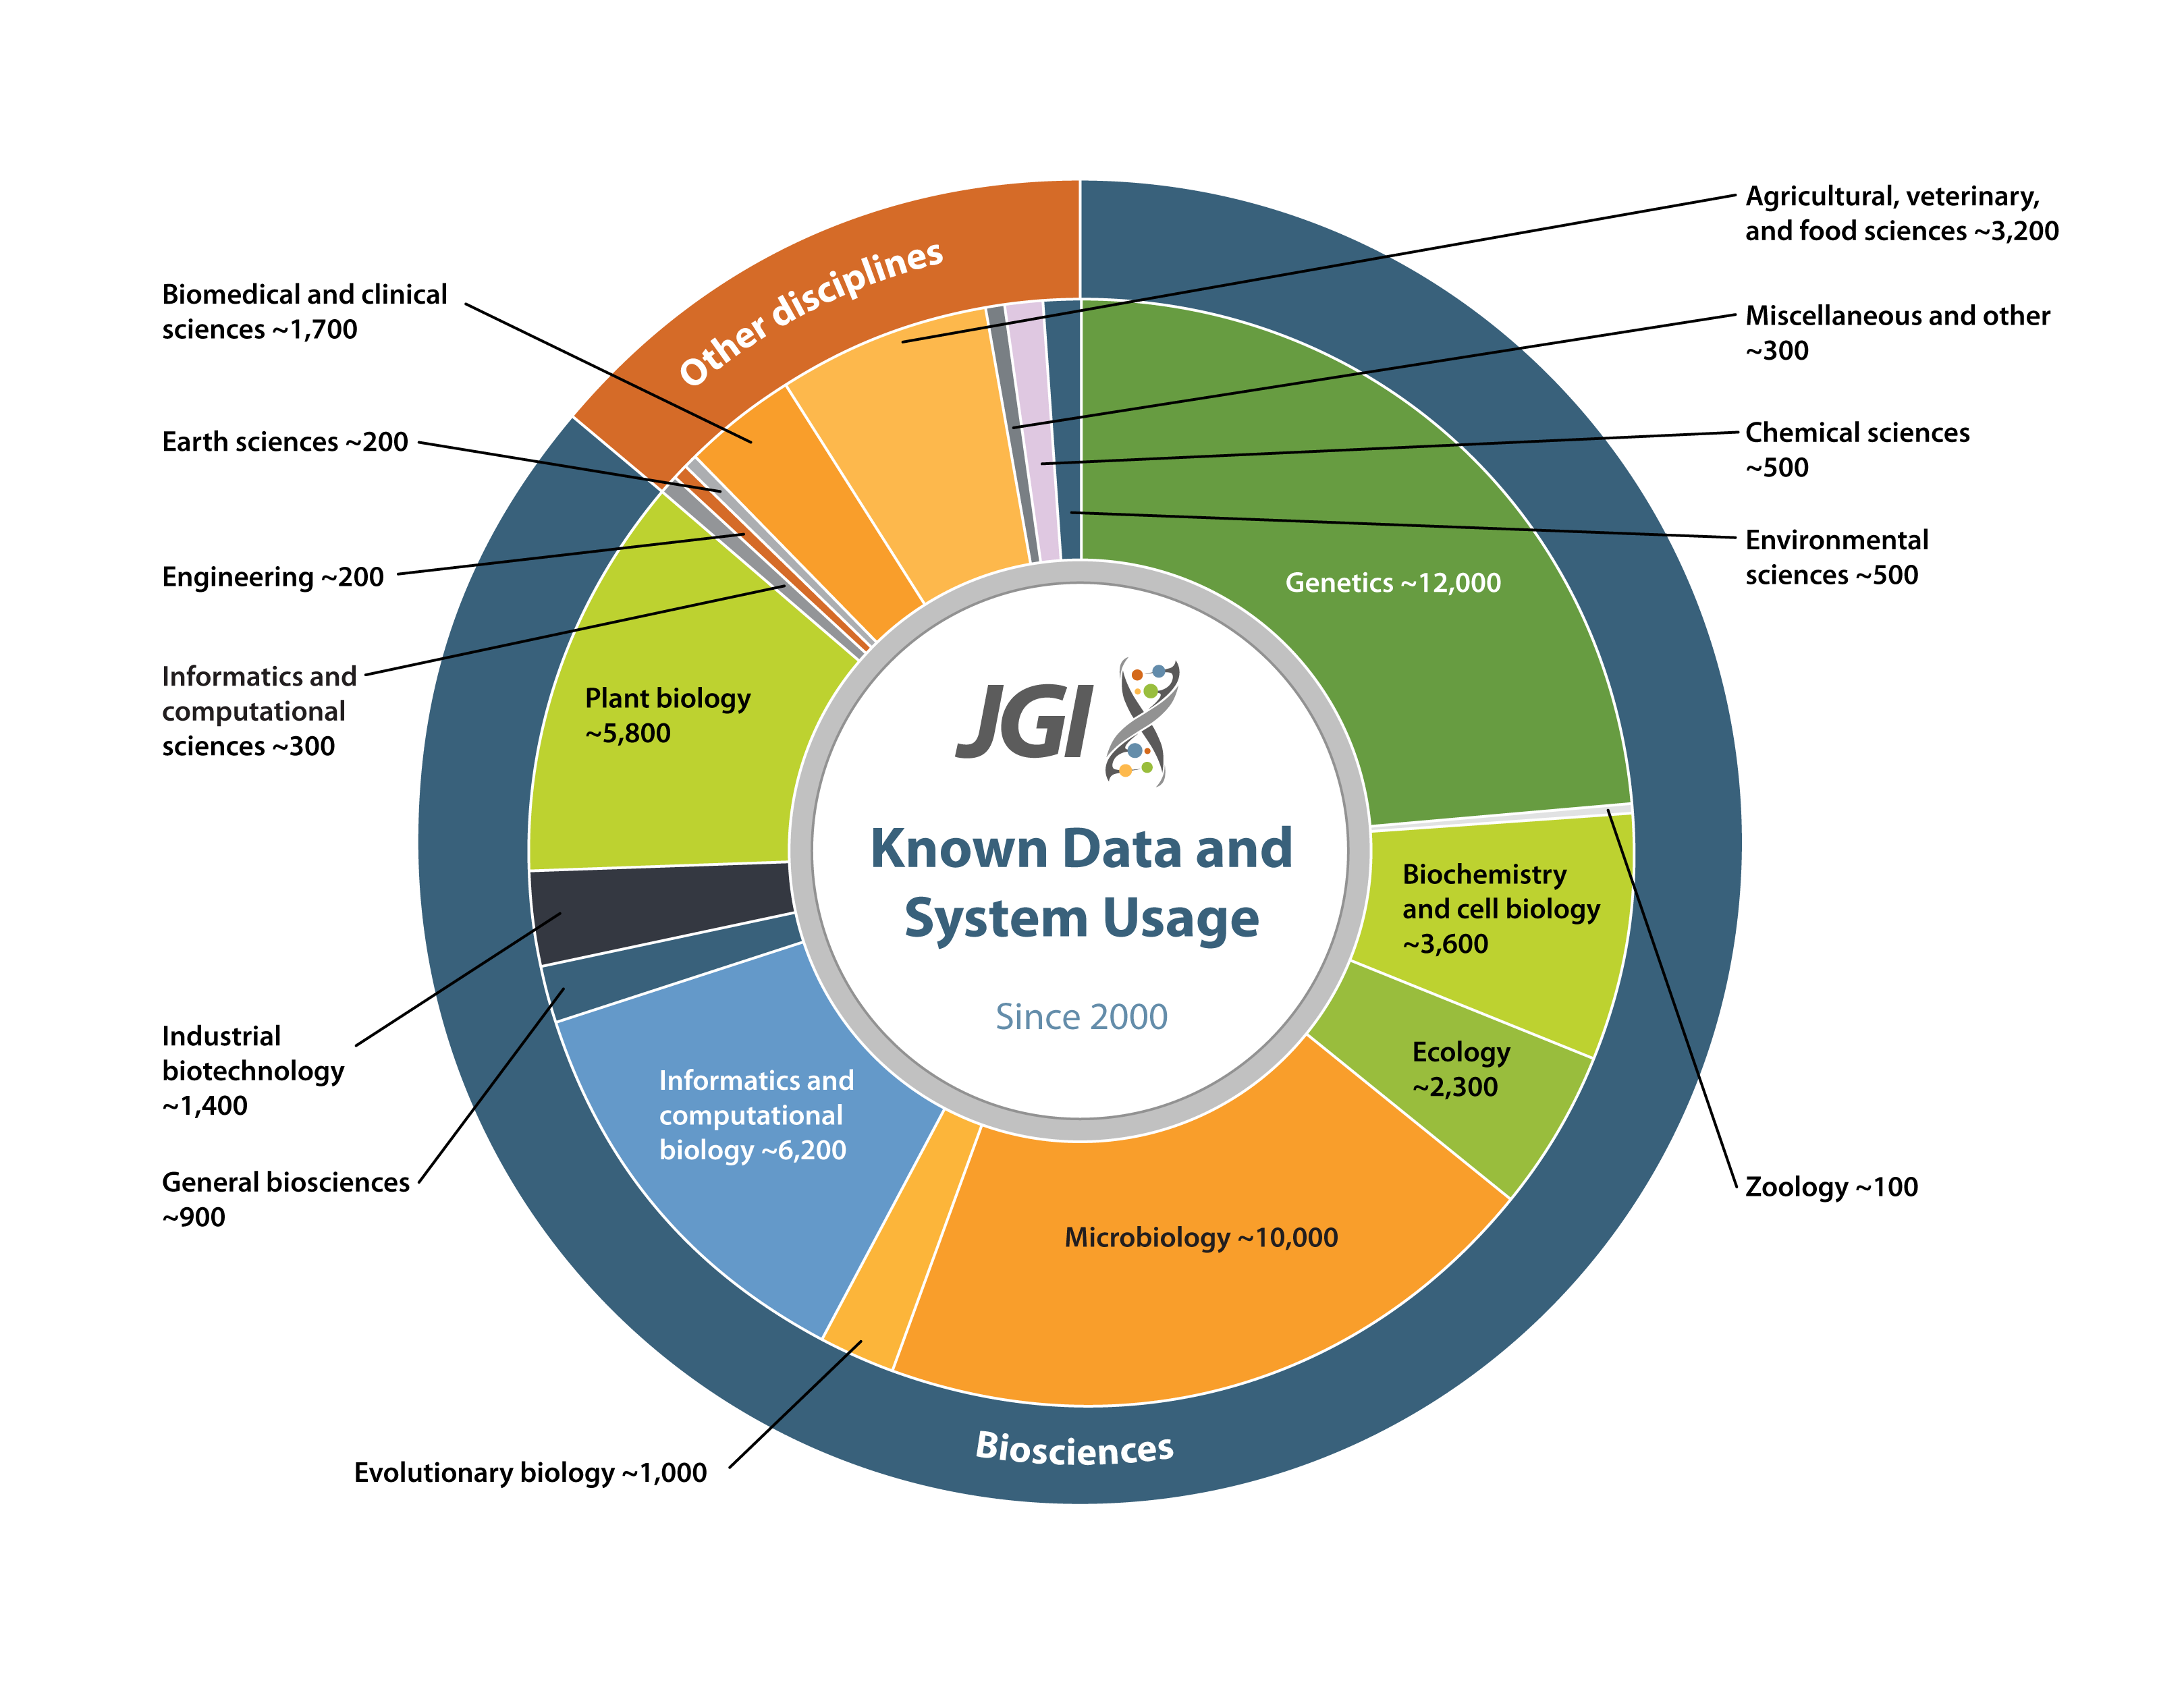
Users of JGI Tools & Data
The Genome Portal provides unified access to all JGI genomic databases and analytical tools. Users can search, download and explore data sets available for all JGI sequencing projects including their status, assemblies, and annotations of sequenced genomes. The Data Portal allows JGI users to more easily access public data sets through a common set of metadata across files submitted by each scientific program. The Genome Portal will be retired once the Data Portal reaches data- and feature-parity with its predecessor. FY2023 improvements to the Data Portal include improved data parity, cart download, navigation by pagination, and significant progress on privileged access and access management.
JGI Archive and Metadata Organizer (JAMO):
15.192 million file records
JAMO Archived Data Footprint:
15.952 Petabytes
Data Downloads in FY23:
Genome Portal: 7.286 million file-downloads
Data Portal: 0.633 million file-downloads
Total: 7.919 million file-downloads
Since the retirement of NERSC’s Cori system, a number of JGI’s pipelines and processes have moved out of NERSC to the JGI’s new informatics cluster, Dori, situated at LBL’s LabIT, and the computing infrastructure at IGB. This has required JGI’s data management system, JAMO (JGI Archive and Metadata Organizer), to expand operations across data centers — both ingesting new data and delivering data stored at NERSC for processes running at these other centers. This has been our first step in creating a distributed version of JAMO, which in the future will be capable of sharing data across registered lab members.
As part of our business continuity planning, JGI has worked with the Environmental Molecular Sciences Laboratory to enable JAMO to automatically transmit and store files on EMSL’s HPSS tape system via Globus. Currently, all new raw sequencing data is being transmitted. Over the next year, all legacy data will be restored from NERSC’s tape system and transmitted automatically to EMSL.
Computational graphic by Neil Byers, JGI. Photography and cinemagraphs by Thor Swift, Berkeley Lab. ‘By the Numbers’ infographics by Creative Services, IT Division, Berkeley Lab.